Here is an experiment on measuring the lifetime of the muon that demonstrates one of the most mysterious of the fundamental principles of quantum mechanics: at the fundamental level what happens is determined by chance. It relates to Einstein's well known discomfort with quantum mechanics. He couldn't accept that God plays dice.
We're going to measure the lifetime of the muon, that is, how long it lives before it decays. The muon is a fundamental particle that is exactly like its cousin the electron except that it has a mass that is about 200 times greater. It was discovered in the 1930's by people studying cosmic rays. Because of its mass, the muon is unstable and decays on average in about 2.2 micro seconds (2.2 x 10⁻⁶ s) to an electron, an electron anti-neutrino and a muon neutrino.
A small fraction of the cosmic ray muons that hit the detector paddles lose all of their energy and come to rest in the paddle. When a stopped muon decays, the daughter electron will produce a signal in the detector. In this experiment, we'll identify those muons that stop in the detector and we'll measure the time difference between when they stop and when they decay. We will then plot these times and observe that they form an exponential distribution which an average value of 2.2 μs.
This demonstrates one of the basic principles of quantum mechanics. As is the case for all elementary particles, all muons are identical to one another. They each have a definite mass, electric charge and spin. There are no other distinguishing characteristics and so when can distinguish one from another. Nevertheless, as we see in this experiment, they decay at different times.
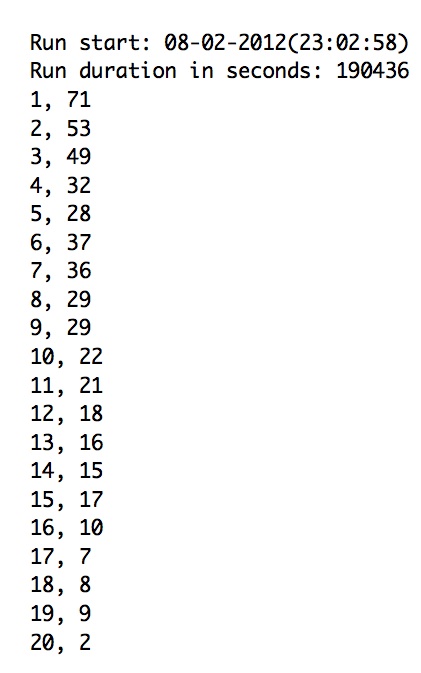
We are going to stack up the four detector paddles and trigger the DAQ on 2-fold coincidences indicating that a muon hit the stack. The number of these two fold coincidences is shown in the "New event counter" on the RUCosmic display. The analysis code will then look at these events and flag those for which the bottom detector did not have a hit. This is an indication that the muon didn't make it all the way through the stack and may have stopped in either the bottom or next to bottom detector. The number of these events is shown in "Stopping muon" counter on the RUCosmic display. For these events, the analysis code will then look to see if there is a delayed signal resulting from the electron produced in the muon decay during a time window equal to the "Gate Width" that you set (4.0 μs). If there is a delayed signal, the time difference between the arrival of the incoming muon and the delayed signal from the muon decay will be recorded. If you click on "File" in the RUCosmic window and then on "Save", the data will be saved in a comma-separated column format as shown in the example below. The first column is the time of the delayed signal in units of 200 nano seconds (200 x 10-9 s). The second column is the number of events with that time delay. You can import this file into Excel and plot and fit the distribution with an exponential to determine the average lifetime.
| Delay Time: | 0.1 μs |
| Gate Width: | 4.0 μs |
| Channel Enable: | 1, 2, 3, 4 |
| Coincidence Level: | 2 |
This page is maintained by
Prof. Steve Schnetzer.